- 56 Posts
- 15 Comments

 2·18 hours ago
If they encountered a really bad storm that reduced visibility to a point where it could be hazardous to drive, they would restrict movement until the storm abated, because they use a series of images acquired throughout the drives to reduce hazards.
Opportunity rover was unfortunate to be affected by such a storm back in 2018, one of its last images (thumbnail) was pointed at the sun, but the sun was barely visible. The solar powered rover did not survive that storm. Such storms would not affect the rovers currently exploring Mars as they are nuclear powered, but operations would definitely be affected.
On the other hand, the solar powered Mars helicopter did have storm days in Jezero. where it was stood down due to increased levels of dust.

 3·1 day ago
I’ve had similar thoughts on this since the end of mission.
We knew early on in the mission that the springs on the legs had been reduced in weight and they were likely to be a failure point one day given enough flights. I assume that’s why they seemed to favour soft landing on isolated ripples during the mission. But those were isolated ripples and caused no issues that we are aware of for the navigation algorithms. One point that was not discussed in the press release, but may come out it the end of mission report was the changes to the team size with team members being released onto other projects. I assume also some team downsizing was accelerated by budget issues caused by the success of the mission and the numbers of flights going way beyond those thought possible. Those team changes may have led to pressures to plan easy routes and accepting the risks by planning flights over those near featureless terrains. IIRC there were issues relating to localisation for the last couple of landings. In hindsight it’s easy for us to say now, maybe after those localisation issues, then rather than plan a pop up flight to reset localisation, they should have flown up and away from the ripple field and pointed it in the general direction towards terrain with sufficient features for tracking and then permit it to decide where it was safe to land. I’m sure there will be more in the formal end-of-mission document. I hope it makes engineering and operational recommendations. I’ll be watching for the release of the full report, and will share it here ASAP.

 4·2 days ago
The main takeaway from the release to me is…
“Although Flight 72 permanently grounded Ingenuity, the helicopter still beams weather and avionics test data to the Perseverance rover about once a week. The weather information could benefit future explorers of the Red Planet. The avionics data is already proving useful to engineers working on future designs of aircraft and other vehicles for the Red Planet.”

 4·2 days ago
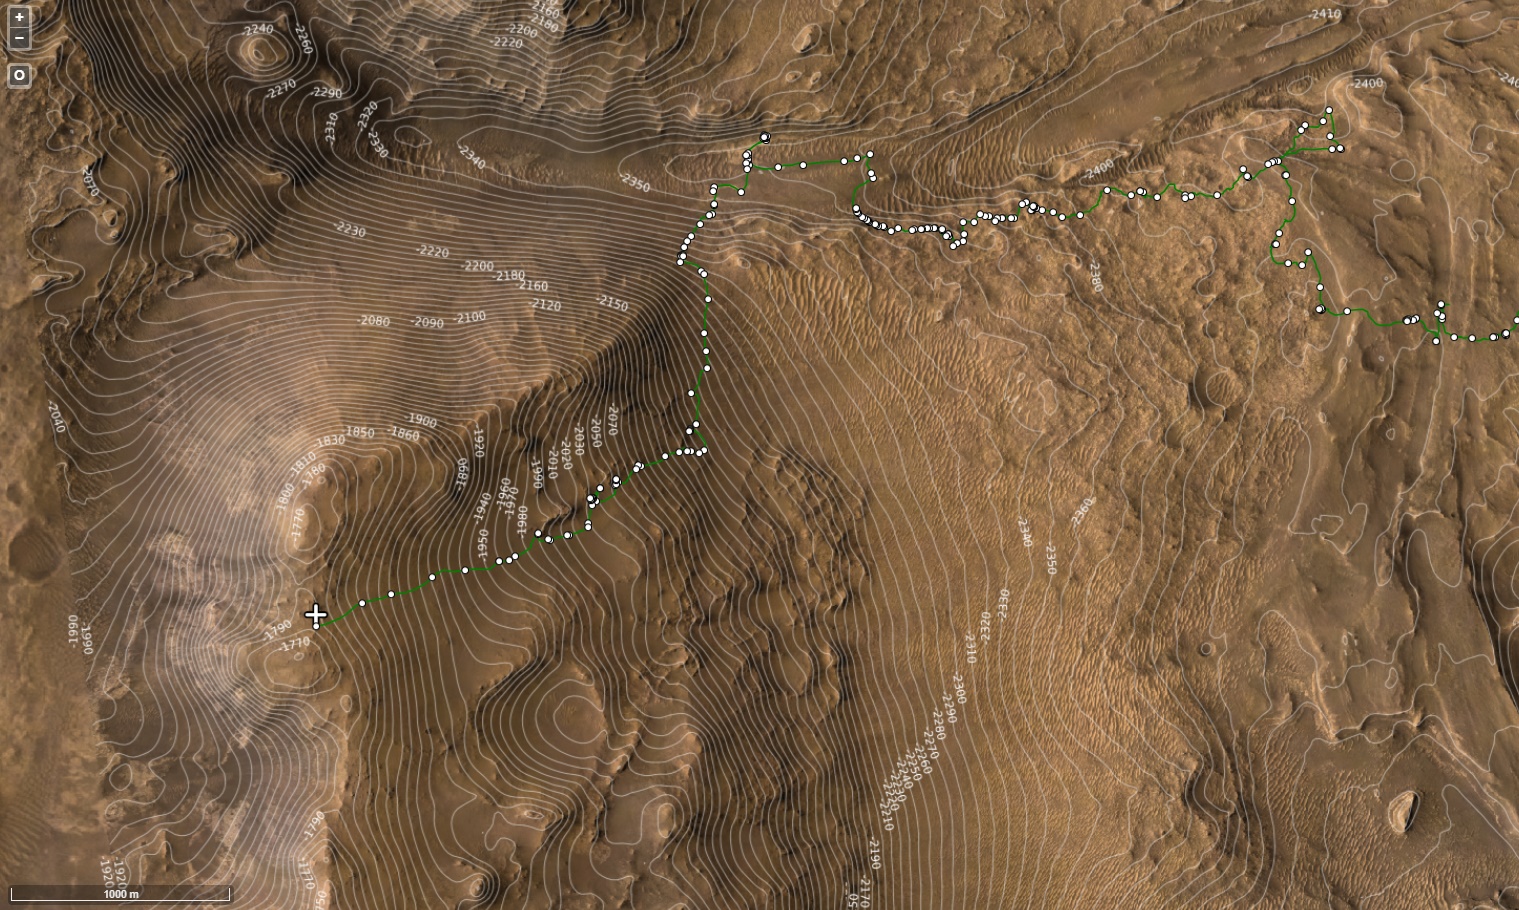
ESA map with contours and scale. Shows we on top of the crater rim.

 2·2 days ago
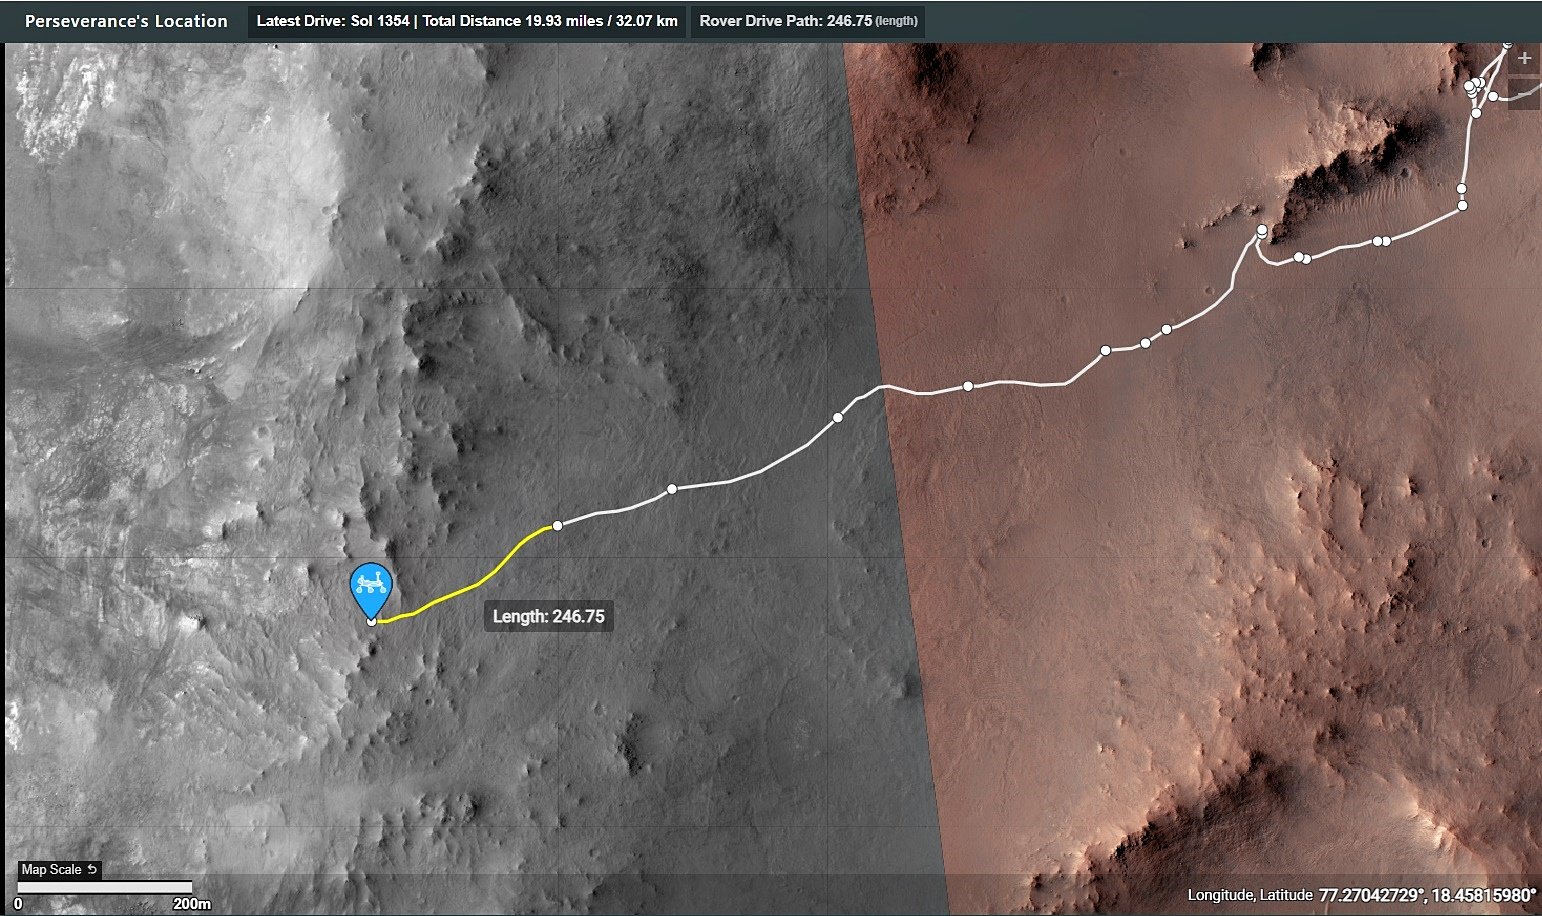
Screen capture of the JPL traverse map

 4·2 days ago
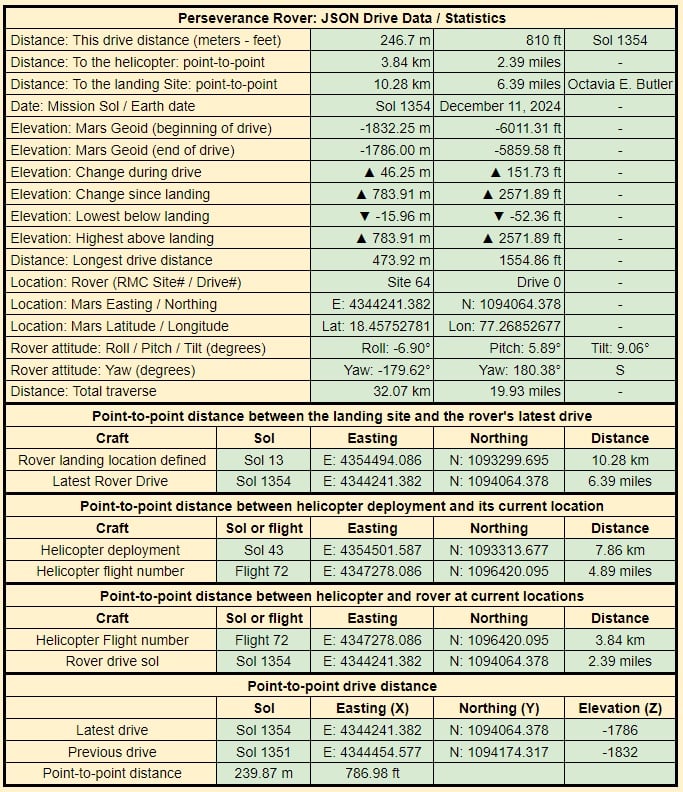
Drive data - New record climb of 46.25 meters (151.73 feet)

 9·2 days ago
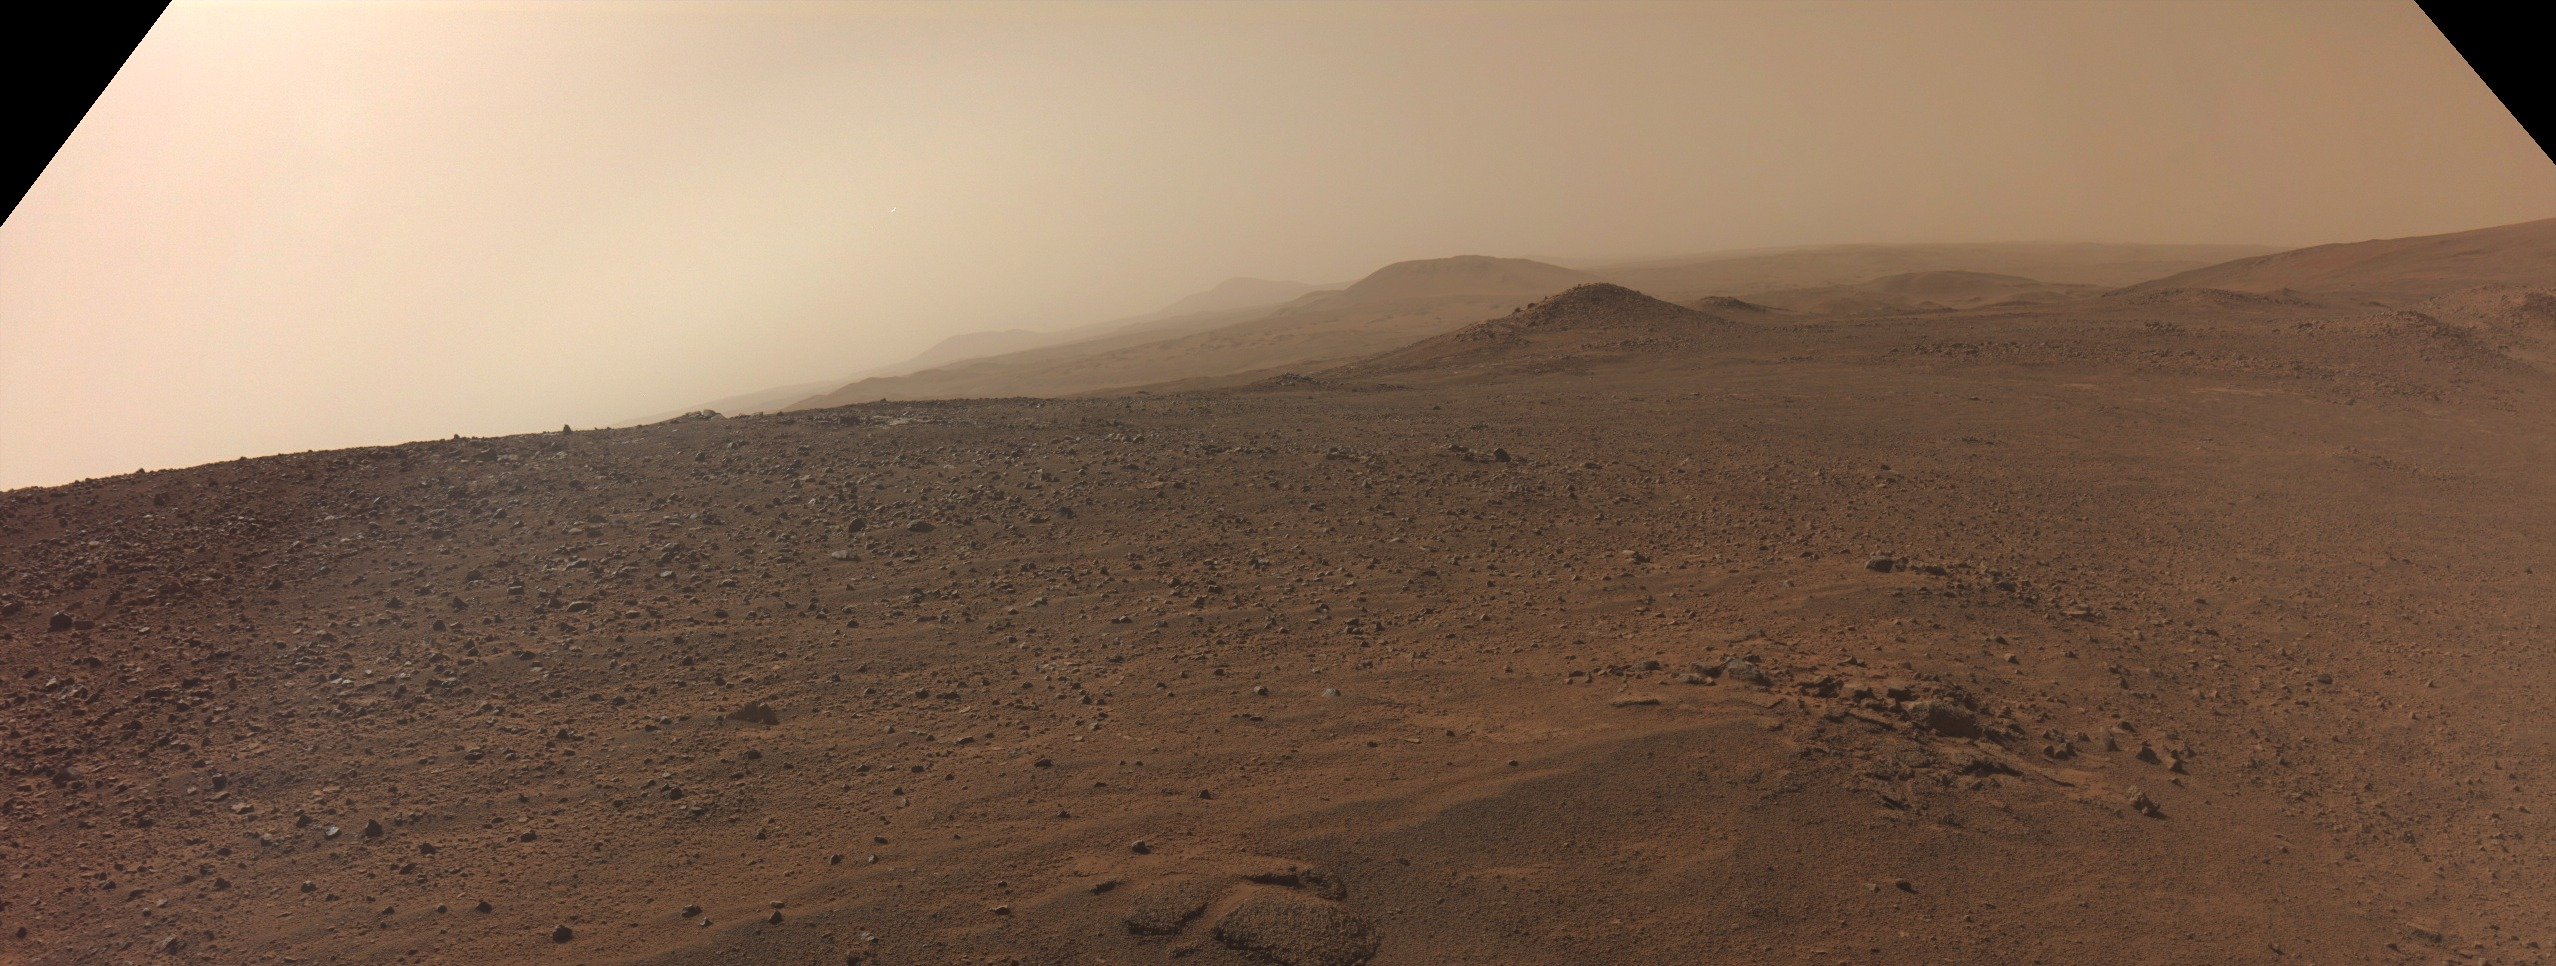
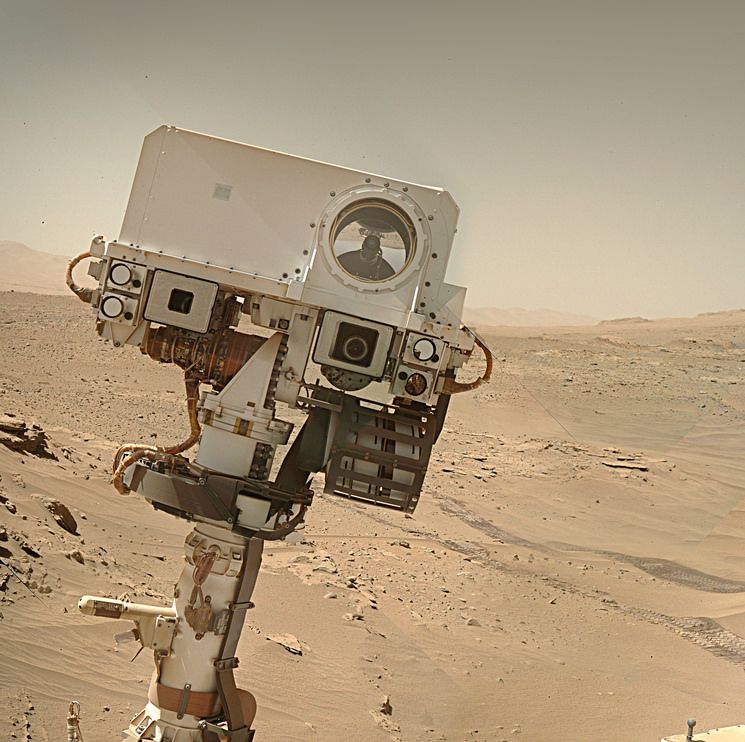
The view towards Witch Hazel Hill (in the distance) The rover’s next major science waypoint
Credits: NASA/JPL-Caltech/James Sorenson

 7·2 days ago
It’s a 3D model created from 3 sets of images, and the Mars Orbiter Laser Altimeter (MOLA) data which was one of five instruments on the Mars Global Surveyor spacecraft, which operated in Mars orbit from September 1997 to November 2006.
MOLA acquired elevation data from all over Mars. That elevation data can be used to make a hi-definition 3D model and the images from the 3 missions can be overlaid on the model to create scenes like these, so they are real images, but overlain on a 3D model of the surface of Mars. The mission teams use these models to plan the rover’s path.
HRSC images: ESA/DLR/FU-BERLIN,
CTX images: NASA/JPL-Caltech/MSSS
HiRISE images: NASA/JPL/University of Arizona

 3·3 days ago
Hopefully one of the geology followers can help identify them :)

 2·4 days ago
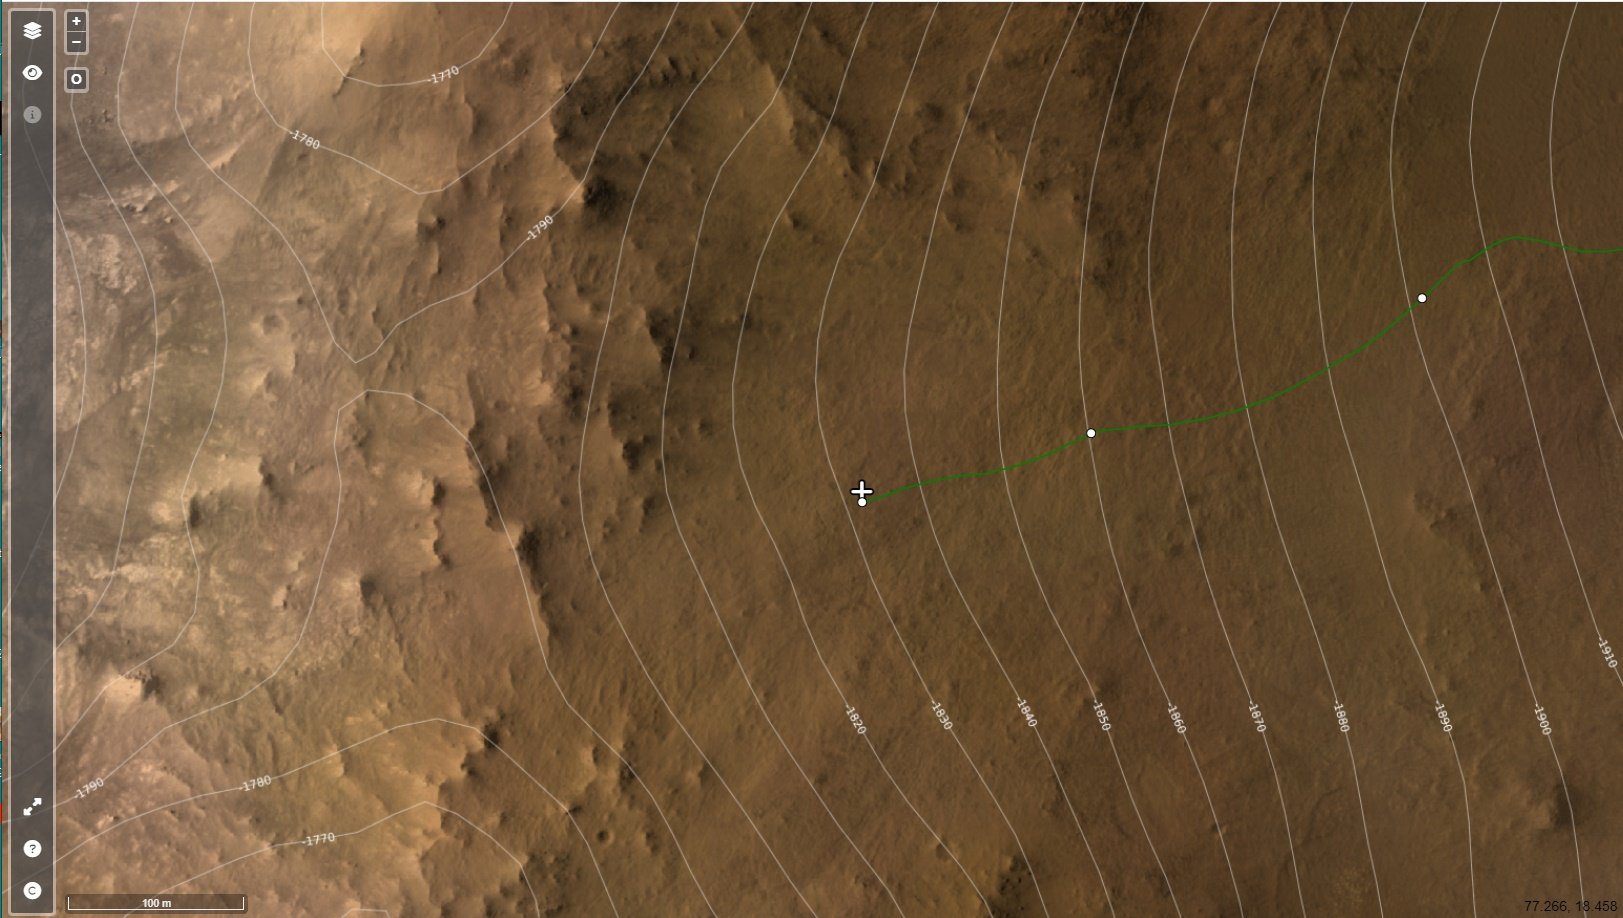
Screenshot of the ESA orbital map, here we can see the 10 meters contour lines and the summit of the crater wall (left side of the map)
Image credits:
HRSC: ESA/DLR/FU-BERLIN, CC BY-SA 3.0 IGO
CTX: NASA/JPL-Caltech/MSSS
HiRISE: NASA/JPL/University of Arizona

 2·4 days ago
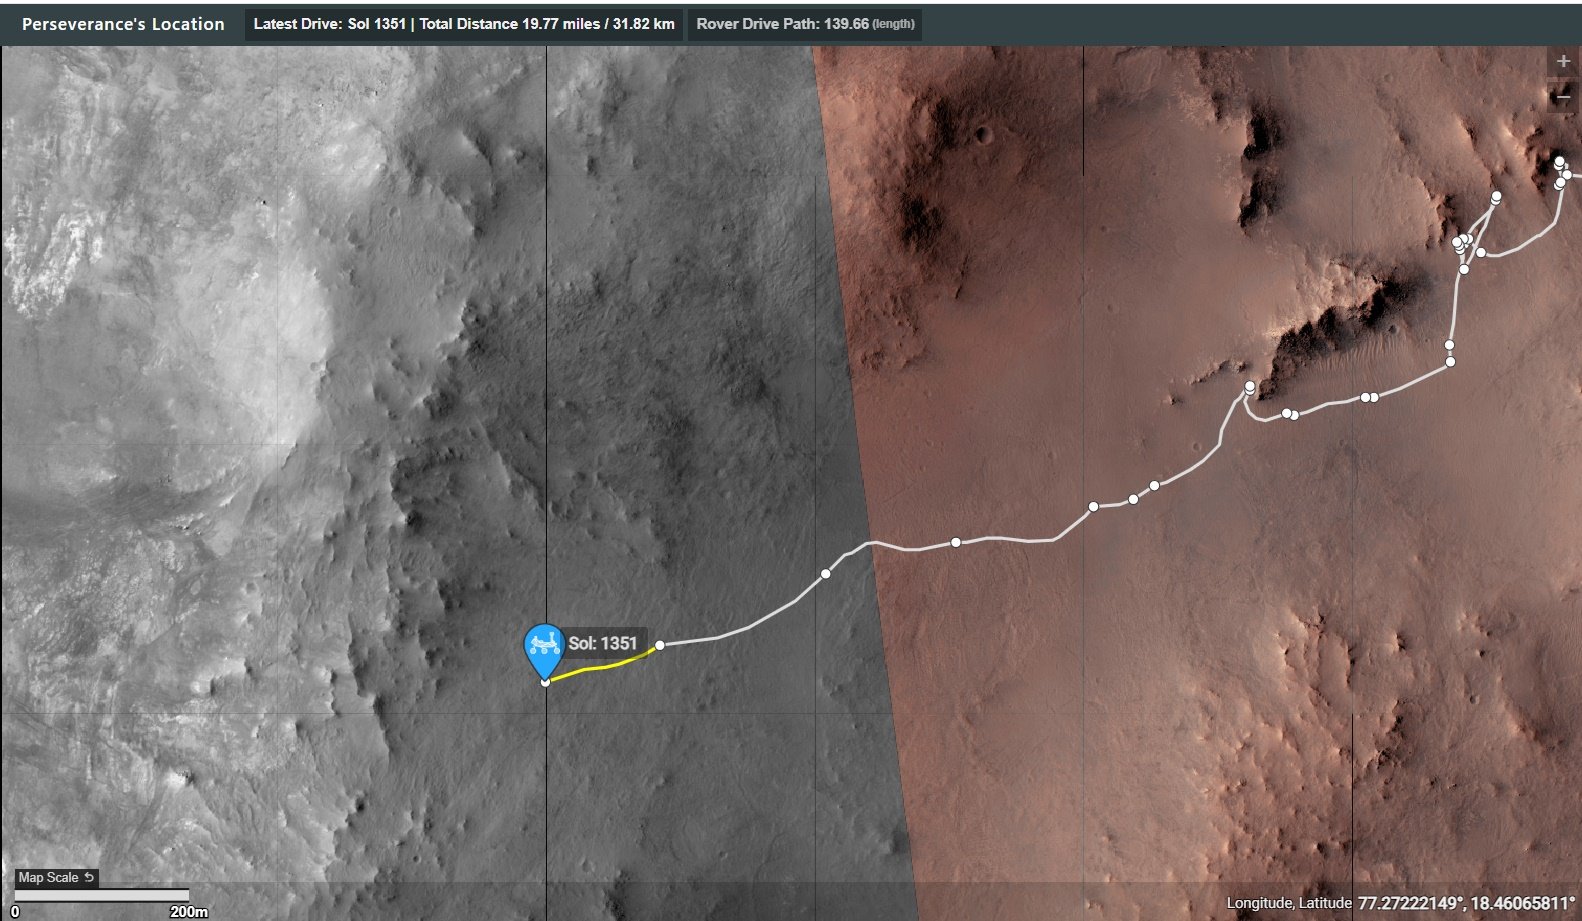
Screenshot of the JJPL map.
The 1351 traverse is highlighted in yellow

 2·4 days ago
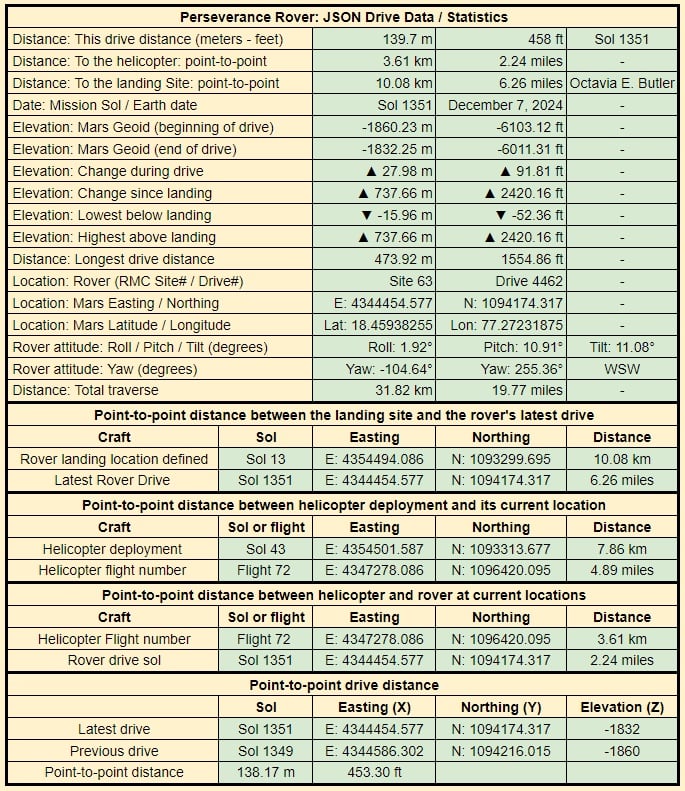
Drive data, the official climb was just under 18 meters. The distance was close to 140 meters :)
A couple more drives and we could reach the summit, but there’s a few rocky outcrops that may warrant investigation by the science team before the top.

 1·5 days ago
If you want scale for the location featured in the MastCam, watch this video https://youtu.be/h5kGOY5mmco

 1·6 days ago
Displaying for me, but I’m viewing from a Windows PC using a Brave Browser.
It travelled a distance of 45.16 kilometers (28.06 miles)